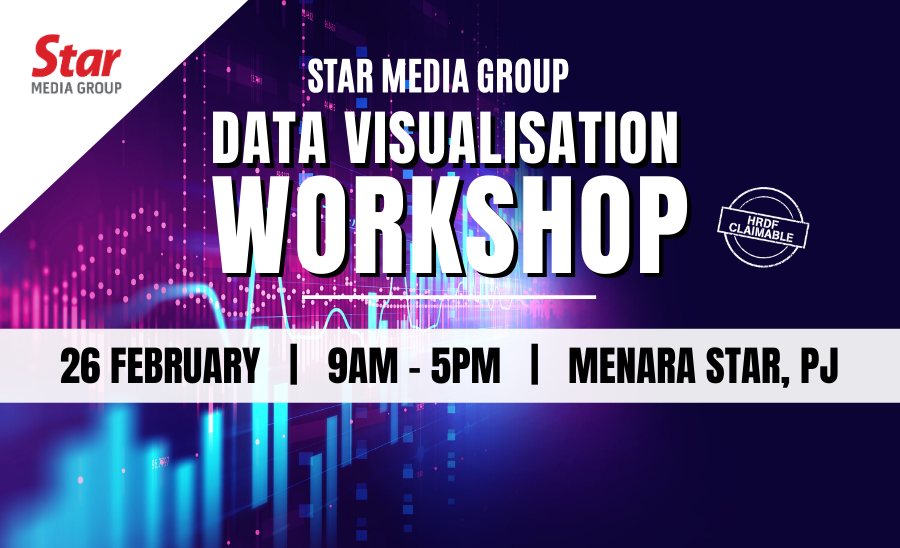
The goal of this 1-day workshop is to enable you to bring data to life and use it to communicate a story to an audience, with a focus on simplicity and ease of interpretation. This is accomplished through a mix of data visualization and best practices, and practical application.
Tableau has revolutionised business decision making with its rapid-fire BI solution, empowering business users with new levels of speed and convenience.
But what makes Tableau that revolutionary? What are the benefits of using Tableau? That’s what we are going to show you!
Our trainer will guide you through several examples, showing you the main functionality of the software and you will learn how to use Tableau to build your own dashboards and stories.
What you will learn:
- Understand the basics of visualization
- Connect your data and understand Tableau terminology
- Filter and sort data effectively and work with date fields
- Organize your data with groups and hierarchies
- Create basic calculations including basic arithmetic calculations, custom aggregations and ratios, date math, and quick table calculations
- Use the Tableau interface and paradigm to effectively create powerful visualizations like geographic maps, dual-axis charts, highlight tables, and more
- Build dashboards to share visualizations
- Understand how some major organisations use data visualization tools
*Specific topics subject to change
Register today!
For any questions and inquiries, do contact us at events@thestar.com.my or +603 7967 1388 ext. 1432
See you there!


